Figures for the latest NO₂ for Greater Manchester have just come out for 2025. Just a reminder that Nitrogen Dioxide (NO₂) is a harmful pollutant formed mainly from the burning of fossil fuels in vehicles and industrial processes. It can harm our lungs through inflaming airways and worsen respiratory conditions such as asthma. The ten district councils that represent the Greater Manchester Combined Authority are directed by the government to reduce roadside levels of NO₂ to an annual mean level of 40 µg/m³ by no later than 2026 (this is laid out in the Environment Act 1995 (Greater Manchester) Air Quality Direction 2025). They have set out how they will achieve this in their GM Clean Air Plan (CAP) Their plan is based on a number of investment-led measures, predominantly based on transitioning buses and taxis towards electric vehicles (rather than reducing car journeys or increasing active travel)
Every year, GMCA measure annual mean levels of NO₂ (in µg/m³) at key sites across Greater Manchester and, in June/July each year, publishes the results of previous year’s measurements in a report called Air Quality Status Report (ASR) on their GM Clean Air Data Hub (which they are legally obliged to do). This report shows progress against actions within the Greater Manchester Air Quality Action Plan (AQAP). However, they don’t really report in any detail on their progress towards achieving the GM Clean Air Plan (CAP). So we have done our own analysis and reporting to help you understand how things are going.
The good news
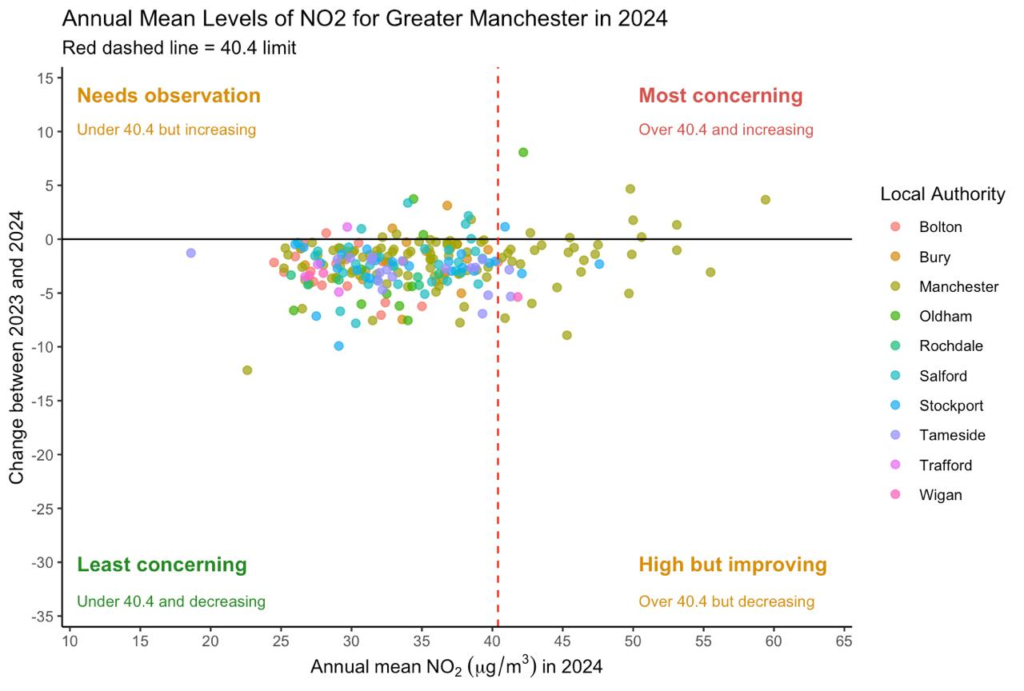
First of all the good news. Things are definitely heading in the right direction with a significant improvement showing in 2025. The figures for 2024 (based on data for all GM CAP reporting sites) showed a large number of sites either over or near 40 µg/m3 and levels still increasing (sites in the top two quarters):
However, 2025 figures show a more promising picture, with no sites that were already over 40 µg/m³ still with increasing levels and 10 sites over 40 µg/m³ but with levels on the decrease (we want to see everything in the bottom left box):
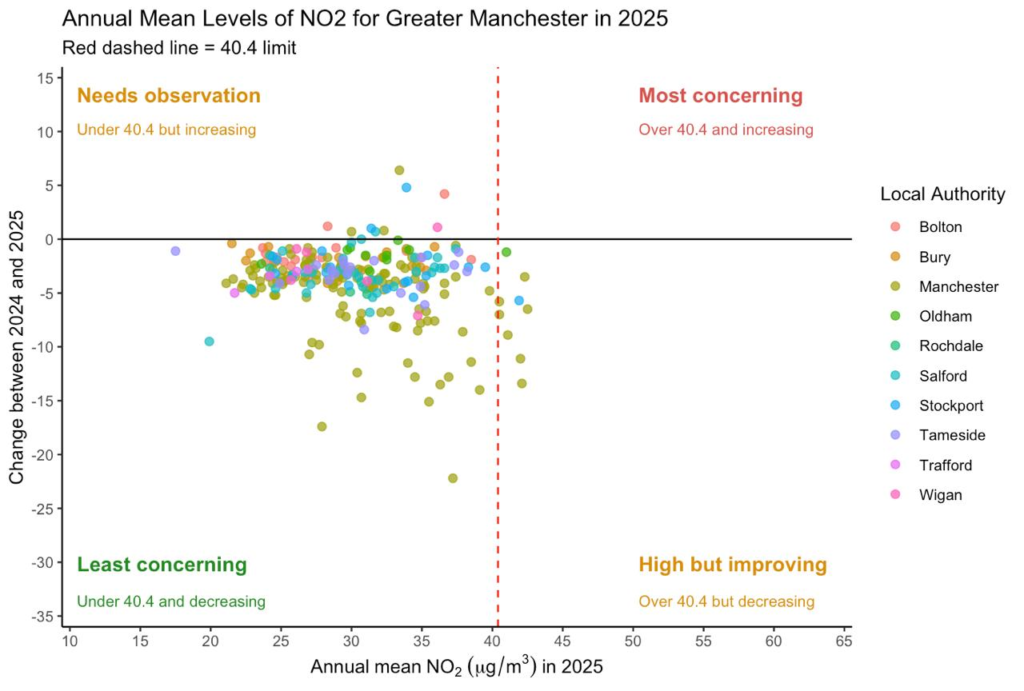
GM looks hopefully to be on target for 2026 for all sites showing levels of 40.4 µg/m³ or below.
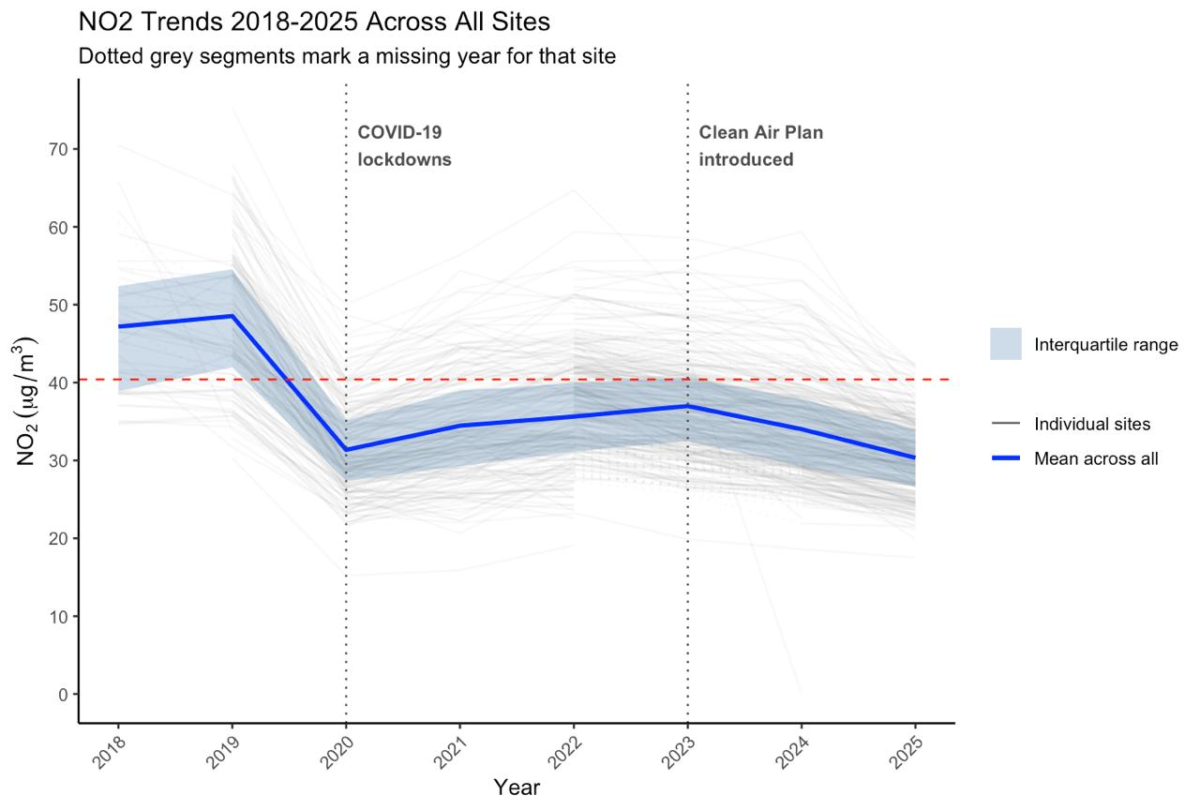
We also looked at the trends over the last 8 years:
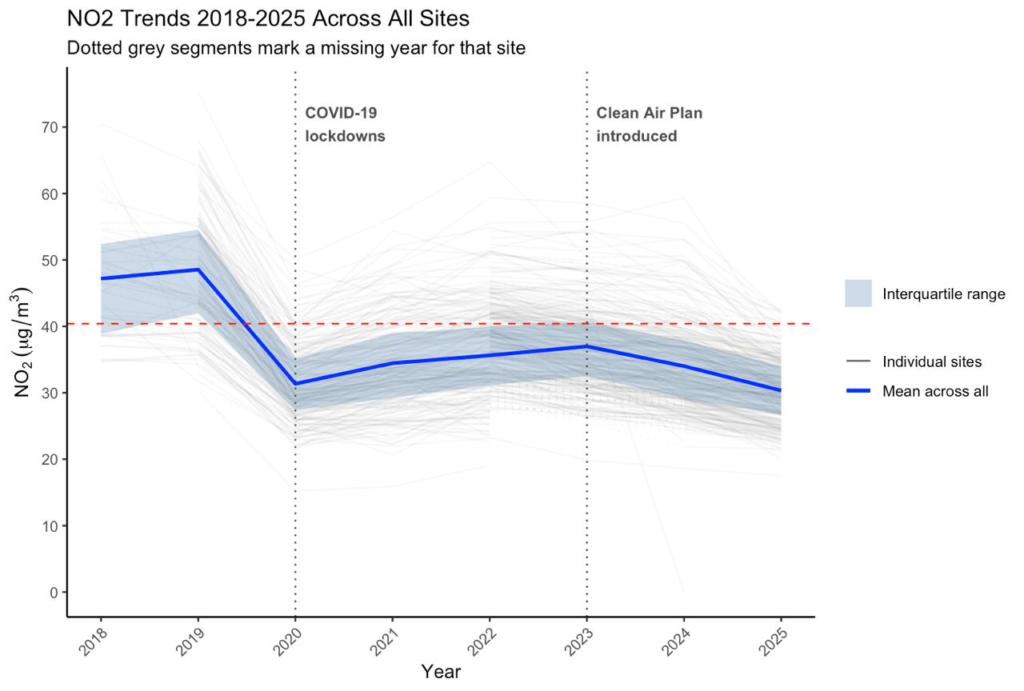
We can see a downward trend and that the introduction of the Clean Air Plan appears to have had a positive effect, as more buses and cars are becoming electric.
So we don’t need to worry?
Further analysis did show some gaps in the data. This is the first year we have been able to look at the targets for 2026 as set out in the original GM CAP versus the actual levels as previously (as there was no correlation in the naming convention of the diffusion tubes in the statistics and those in the GMCAP). This year, following our request, they’ve been added.
The graph below shows progress against the original GM CAP target (shown as a white circle. Green circles show that 2025 levels are already below the target. Red circles show where they are still above the target. Each CAP site has more than one diffusion tube, so each green or red dot represents a specific diffusion tube result from that site:
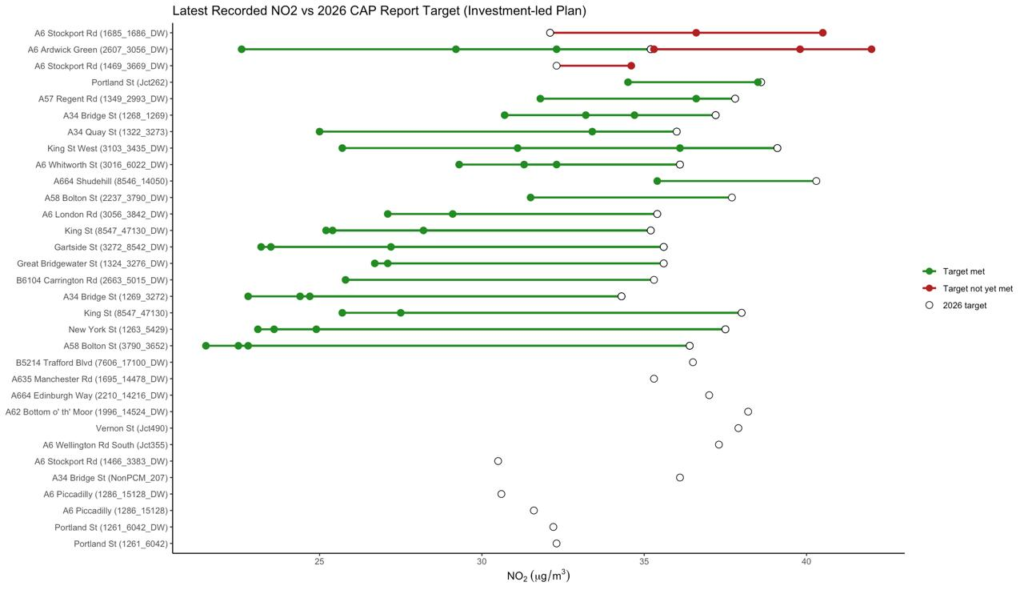
We get a slightly different result to that in the GM LAQM monitoring which showed no exceedances for 2025. There are still 3 sites that have not met their proposed targets for the GM CAP – all around the Manchester end of the A6 (although only 2 are over 40 µg/m³).
There are also 12 sites which have collected no data for the last 3 years so it is impossible to know where they are up to.
It is also worth noting that there are a number of additional sites now reported on in the GM CAP statistics that, whilst they were not in the original plan, are still over the target of 40 µg/m³ (although all levels have decreased since 2024):
| Site Address | 2024 figures (µg/m3) | 2025 figures (µg/m3) |
| A665 (Great Ancoats Street) | 46.3 | 40.5 |
| A6 (Ardwick Green South) | 53.1 | 42.0 |
| A665 (Great Ancoats Street) | 50.0 | 41.1 |
| A57M (Mancunian Way) | 45.8 | 42.3 |
| A665 (Miller Street) | 49.0 | 42.5 |
| Shudehill | 55.5 | 42.1 |
| A6 Stockport Rd | 47.5 | 40.5 |
| A665 | – | 42.0 |
| Oldham Way | 42.2 | 41.0 |
| A626 (St Marys Way) | 47.6 | 41.9 |
What about the World Health Organisation targets?
The World Health Organisation recommends safe levels of NO₂ to be at an annual mean of 10µg/m³ (not 40). They have also set interim targets of 30 µg/m³ and 20 µg/m³ for progress to be measured against. We haven’t done our own graphs for this (using CAP data), but here is the graph from the GM ASR report that shows how we are progressing towards the WHO targets:
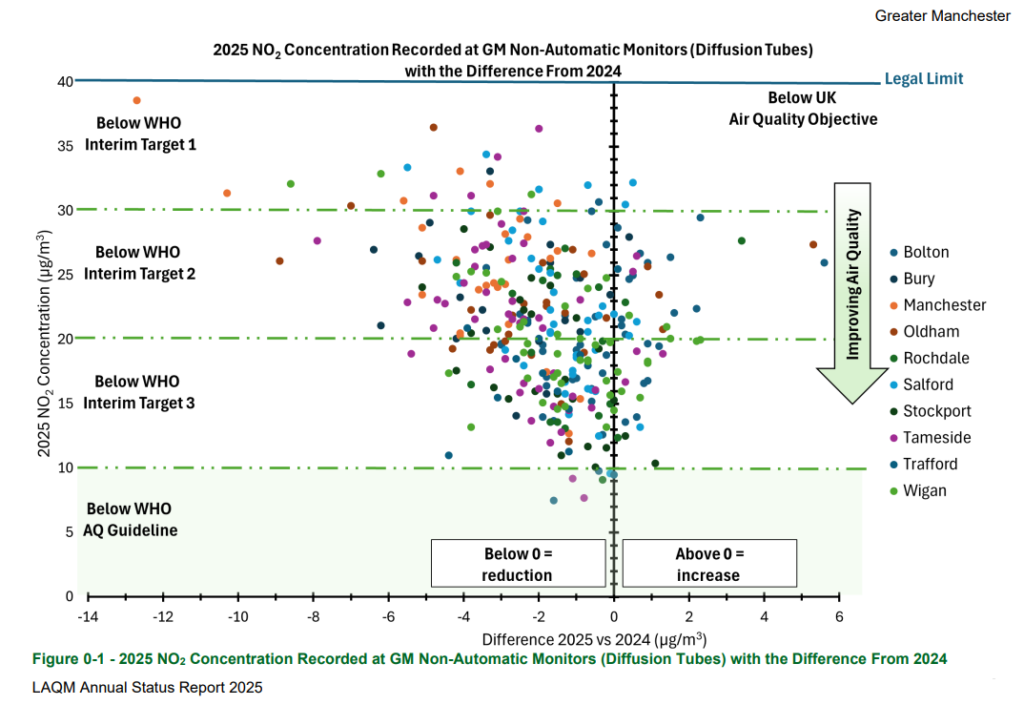
The GM CAP comes to an end in less than 6 months and we have a long way to go to even meet the first interim target of 30 µg/m³. We’d like to hear from our new GM mayor what is next for cleaning up the air in GM. There are currently no targets in the plan for 2030.
Let’s not forget that Manchester has the highest levels of NO2 in the country. Emergency admissions for children and young people with asthma for Tameside and Oldham are in the top three highest in the country at 340 and 332 per 100,000 population ( the national average is 138.8 per 100,000). Emergency admissions for adults with asthma are also higher than average in Tameside, Oldham and Manchester, with the highest in Tameside being 63.3 per 100,000 (national average 44.4 per 100,000).
Will we just wait for time to pass as more vehicles become electric, or will we do more to proactively get people out of their cars and mode shift to using public transport or active travel?
The not so good news
Although it is somewhat hidden in the GM ASR report, statistics are also given on levels of Particulate Matter PM2.5 and PM10. Particulate Matter pollution comes from a number of sources including dust from vehicle brakes and tyres (regardless of whether they are electric) and also domestic woodburning. It harms health by entering the lungs and bloodstream, causing breathing issues, heart attacks and long-term organ damage.
For every site where measurements are taken, levels of both PM2.5 and PM10 in 2025 have increased from 2024. The graph below is taken from p231 of the GM ASR report and shows how PM2.5 levels are on the increase.
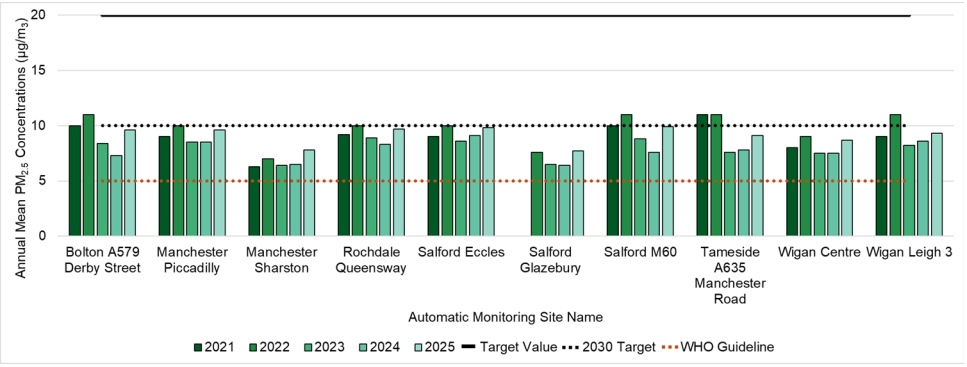
Our Bee Network Manifesto asks that there is a recognition of the Bee Network’s contribution to this type of air pollution.
What does this mean for active travel?
There is a large section in the latest GM ASR report that sets out activities relating to active travel. However, it does not relate them either to the GM CAP or to the lack of progress in increasing walking and cycling referenced in the GM Active Travel report for 2025 which admits:
“There remain challenges that we need to overcome. Progress on our Right Mix Targets is slow and there has been little overall change in the proportion choosing active travel. It’s important to recognise that most people still favour car travel: both car ownership and car trips continue to grow and remain the dominant mode (57% of trips). We still have work to do to convince people of the benefits of the alternatives.“
We disagree with this approach. Best practice shows that the only way to reach the modeshare targets is to provide an attractive choice for users, such as a functioning and widespread e-scooter and cycle hire offering, secure and plentiful cycle parking and high quality road infrastructure, as can be seen by the increasing numbers of cyclists on Oxford Road and the Chorlton Cycleway. Build it and people use it (so long as it’s high-quality and links places).
The lack of significant change in region-wide active travel is a reflection on the lack of infrastructure that has been built.
On cycle hire, London and Edinburgh both have a successful mix of public bike share schemes, which have unlocked significant latent demand for active travel. In Edinburgh, switching from a poorly run government scheme to a private operator has increased trips by 2.6 times, now up to 619,500 rides in the first 8 months. TfGM’s Starling Bikes have failed to achieve the same ridership number over any 8 month period with 5 years of operation.
DfT-sanctioned e-scooter trials expanding outside of Salford would also provide an attractive low-emission alternative to car journeys at minimal cost to taxpayers, but have yet to materialise in Greater Manchester, despite councils willing to work with TfGM delivering a scheme.
The picture develops further when it comes to road infrastructure. The report notes that in 2023, 189 of Greater Manchester’s 1,362 signal-controlled junctions had no green man crossing, and a further 282 were substandard, missing facilities on some arms or lacking tactile signals. Twenty-six crossings have gone in since. On our calculation, that leaves the remaining 445 taking somewhere between thirty and fifty years to reach minimum standards.
The report tells us that 390 zero-emission buses prevent an estimated 23,000 tonnes of CO₂ and 84 tonnes of nitrogen oxides every year. No comparable figure appears anywhere in the active travel content for the 161+ km of Bee Network routes, including successful routes on Oxford Road and Deansgate with 3,000-4,000 trips per day during weekdays or for the 39 plus School Streets. Not for 504,807 cycle hire rides and not for the two million trips logged by the Salford e-scooter trial. The last two are app-based schemes where every journey is recorded.
All this leaves active travel without quantifiable data which can prove its success against clean air targets.
Our asks
- An annual progress report based on the GM CAP reporting data, alongside the GM ASR report showing LAQM data
- That TfGM investigates and rectifies missing data for GM CAP 12 sites with no data
- An outline plan of how GMCA will move from the current target of 40 µg/m³ to the WHO recommended interim target levels of 30, 20 and eventually 10 µg/m³
- That TfGM does some targeted research on mode choice for locations with existing high quality public transport and active travel infrastructure to identify if this does make a more positive impact on mode shift
- That TfGM reports on the Bee Network’s contribution to particulate matter (PM) air pollution and explores measures to mitigate it across the city region
- Stronger measures to disincentive short car journeys and increase sustainable or active travel